Electricity

Get Started with ENGIE

ENGIE Resources is ready to analyze your historical energy usage data and present appropriate options. Get started now

Customer Service

Keeping up with the latest electricity insights and information can be a full-time job. View our customer services

Find Out If ENGIE Serves Your Area

Enter your zip code to find out if ENGIE serves your area. View zip code finder

ENGIE 20/20 Reporting Platform

Simplify your energy reporting. Reduce your energy expenses. Increase your energy income.

ENGIE 20/20 is a market-leading energy data management platform that uses cloud-based software to collect, automize, and analyze utility invoices, energy metrics, and sustainability data.

Features include

  • View energy spend across an entire portfolio, or drill-down to view account-level data for one site;
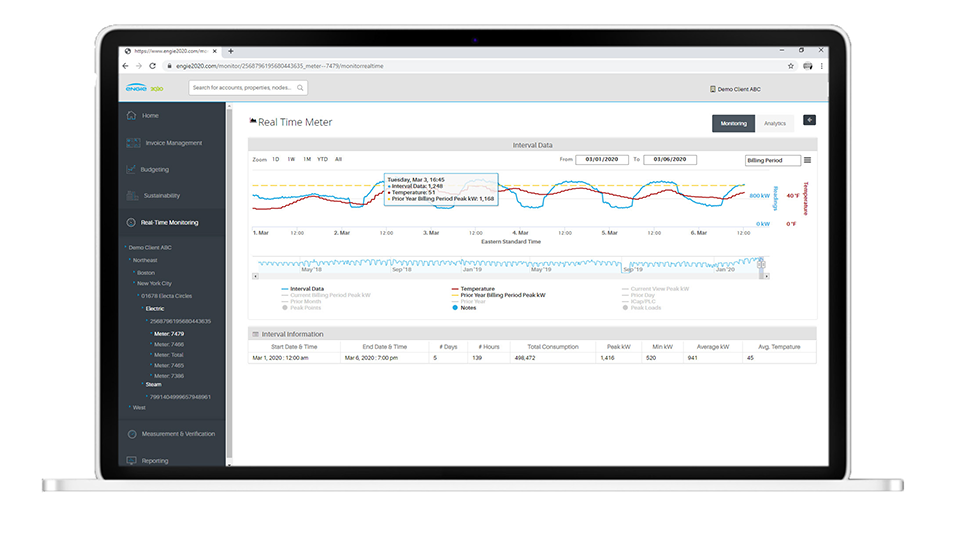
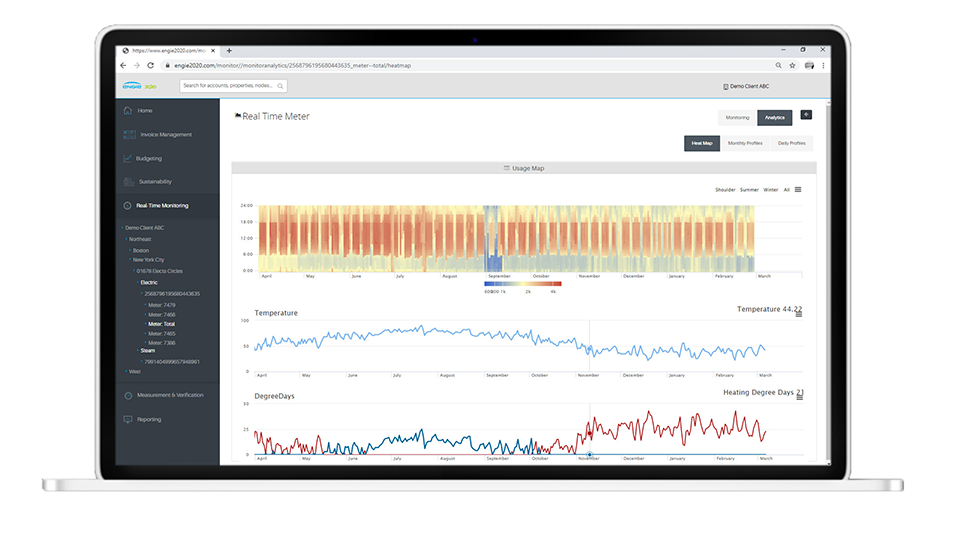
  • Receive insight into your energy use, demand, and cost trends by benchmarking against key performance indicators;
  • Identify usage and demand anomalies that allow you to take proactive action and control energy costs;
  • Your team gets notified of anomalies to help alert and determine the cause.

To learn more, view our brochure or contact us to request a demo.

Proactive Insight into Controlling Energy Spend
engie 2020

Dashboards
Create custom dashboards with different widgets and KPIs and share them across various teams and business units

energy-reporting-dashboard

Invoice Management

  • Auditing and data checks, with ability to set alerts
  • Access to invoice images and all line items
  • Built-in asset and property characteristics
  • View peak demand summaries, ICAP and PLC tags, and different invoice summaries that may include use per day, cost per day, demand, and cost per unit
ENGIE-2020-energy-reporting-dashboard

Reporting

  • Custom Reports with the ability to automate: Position Report, Bill Component Report
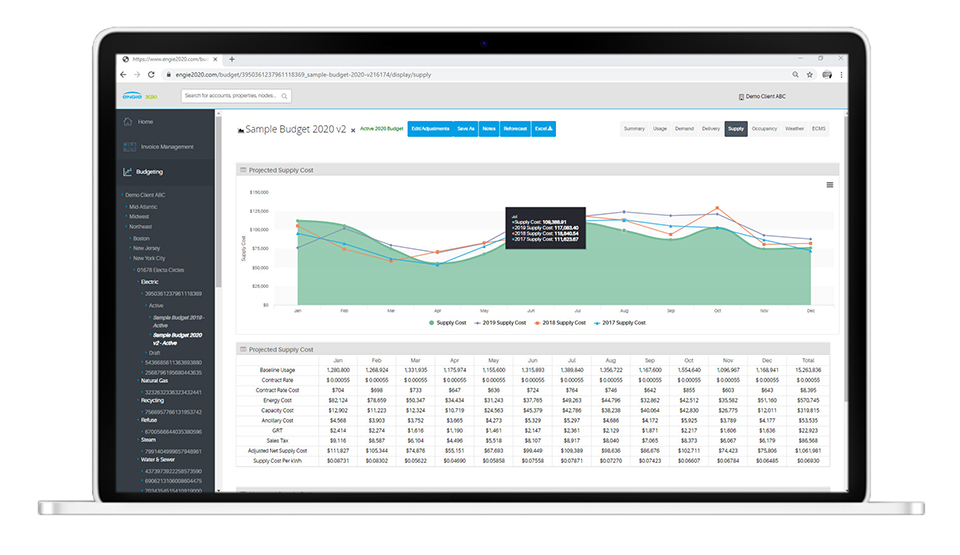
  • See the breakdown of supply and transmission costs over time as well as a summary of all properties
  • Generate multiple reports on demand to analyze trends, performance variance, and more
  • Track year-to-year, year-to-date, month over month overviews

To learn more, view our brochure or contact us to request a demo.